The United States on the brink of bankruptcy
With long-term interest rates rising and a growing debt burden, how high can the US borrow? Currently, at 4.6%, this maximum rate will fall to less than 3% over the next ten years, a major challenge for yield-seeking investors and the US government.
A Sustainable Debt
Investing in US debt gives you access to the ultimate risk-free asset — a liquid and secure asset in the international reserve currency, the foundation of any diversified portfolio. Since the creation of the debt ceiling in 1917, the United States has scrupulously honoured its obligations despite the many tensions surrounding raising the ceiling. Thanks to this faultless track record, the United States and investors benefit from this stability.
While the tensions and risks of default have been political and partisan until now, a threshold exists beyond which a government can no longer honour its debts sustainably. When this threshold is crossed, the patiently constructed edifice of stability collapses, with enormous consequences. Imagine the global systemic repercussions of a default on US public debt or bankruptcy of the United States.
2024: A Bad Year
This threshold is reached when the cost of the debt is equal to the profit it generates: this is the breakeven point. When the cost exceeds the benefit, a loss results that progressively impoverishes the nation, culminating in a debt crisis like that of the eurozone in 2010.
To estimate this threshold, we approach the US economy as a business. GDP is the value added by America Inc., and public spending is an investment. GDP growth is the national dividend distributed to citizens, and debt interest is the investment cost.
Investment is partly financed internally through taxation, which does not cover all needs. The remainder is funded on the capital market by issuing government bonds, which together make up the debt.
The United States's financing needs are substantial. In 2024, the fiscal deficit represented 6.3% of GDP, as illustrated in graph 1. Properly speaking, investments were 3.3% of GDP — the primary balance — and debt servicing, which we call the effective cost of debt, amounted to 3.0% of GDP for a federal debt of 120.7%.
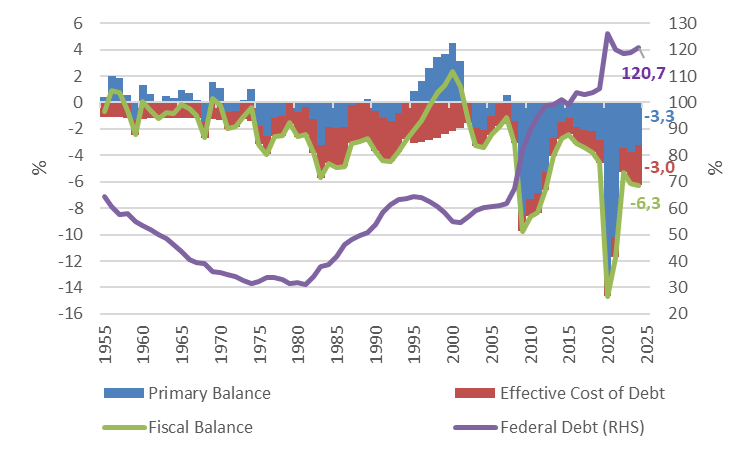
What does an annual interest burden of 3% of GDP represent? Interest on the US debt amounted to USD 881 billion in 2024, a cost of USD 100 million per hour! With 10-year refinancing rates at around 4.5% and rising debt, the question of the government's ability to honour its debt is real.
According to the latest Bureau of Economic Analysis estimates, nominal GDP grew by 5.1% in 2024, while the need to finance public spending (the fiscal deficit) stood at 6.3%. According to our approach, the national dividend (5.1%) does not cover all the financing requirements (6.3%), resulting in a net loss of 1.2% of GDP. As a result, the federal debt is increasing, and the country is becoming poorer.
Breakeven: The Threshold Not To Cross
The threshold that must not be crossed is the one where nominal growth no longer covers the cost of the debt. In this case, the debt ratio rises indefinitely, the country becomes poorer, and the edifice of stability that has been patiently built crumbles and then collapses.
Now that all the elements are in place, we can estimate the breakeven point. The estimates are expressed in terms of yield on debt rather than % of GDP to make the results directly usable for investors.
Graph 2 shows the evolution of breakeven from 1955 to the present day, with projections to 2034. Before looking ahead to the end of 2034, the seventy years of observations since 1955 provide us with three lessons that give us a better understanding of the current situation.
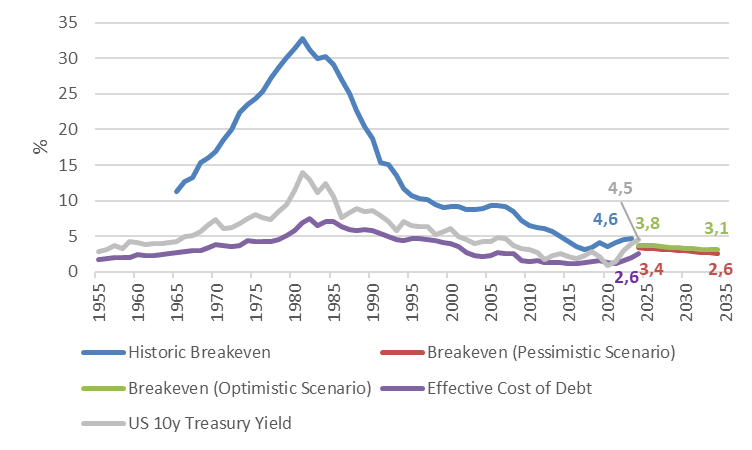
- The first observation is the steady decline in the breakeven rate since 1980 to 4.6% today (blue line). This curve indicates the maximum rate of financing that a government can afford without impoverishing itself. If the United States were to refinance all its debt today with a 10-year maturity at a rate of 4.5% (grey line), it would be just below the breakeven point, with the national dividend barely covering the cost of the debt.
- The second observation is that the profit margin on public investment is shrinking, limiting the State's room for manoeuvre. Currently, at 2.6%, the effective cost of debt (purple line) is lower than the breakeven point (4.6%), generating a net economic benefit of 2.0%.
- The third observation is the close link between the 10-year yield (grey line) on US bonds and the effective cost of debt. This shows that sooner or later, the rise in long-term yields will be reflected in the effective cost of debt, reducing the economic benefit and calling into question the sustainability of US debt.
The Challenges of the Next Ten Years
Graph 2 also shows two breakeven scenarios1, a pessimistic one (red line) and an optimistic one (green line). In both cases, the United States' financial capacity is falling. In the optimistic scenario, the breakeven rate falls from 3.8% in 2025 to 3.1% in 2034. In the pessimistic scenario, the breakeven will fall from 3.4% in 2025 to 2.6% in 2034.
With these figures in mind, US interest rates are too high. They will inevitably have to decline over the next few years to deliver economic prosperity in the US and financial stability worldwide. Are you prepared to accept yields between 2.6% and 3.1% with a debt ratio around 140%?
Interest rates will be the focus of attention to accommodate inflation and debt. Unfortunately, killing two birds with one stone is impossible, and this will lead to a radical change in monetary policy. The focus will either be on debt stability and, hence, the systemic stability of the global financial market, or a new tool will be created to accommodate inflation and debt.
Adding a second tool to the central banks' toolbox is the most appropriate solution. In this eventuality, I believe that interest rates will be used primarily to manage debt and exchange rates for inflation and economic growth, throwing us into a new paradigm and forcing us to invest differently. Read the sequel: Central Banks' Interest Rate Setting is Dead.
1. The scenarios are based on 10-year breakeven inflation expectations, which fluctuate between 2% and 2.5%. Inflation of 2% is used for the pessimistic scenario and 2.5% for the optimistic scenario.
This article is a translation of a column originally published in French on Allnews.ch.
← All publications